When should I go to the gym?
January 6, 2022
data, devops
I, like many people each year, have decided to start exercising more. The droves of New Year's Resolution workouters is great for business*, but unfortunate for someone who hates crowds and waiting. The popular 24/7 climbing gym in my neighborhood has a real-time headcount (curiously they only have it for the Brooklyn location). I'm not actually a member of this gym as of this writing.

Rather than picking a time and checking how many people are there at that time, like a luddite, I wanted to know when would be the most optimal time to go. This would require me to programmatically and periodically check the website and store the headcount. Lucky for me, the number is available through a public, unauthenticated API (it's just a web address that spits out the number) and I already have the free software running to collect and visualize the data.
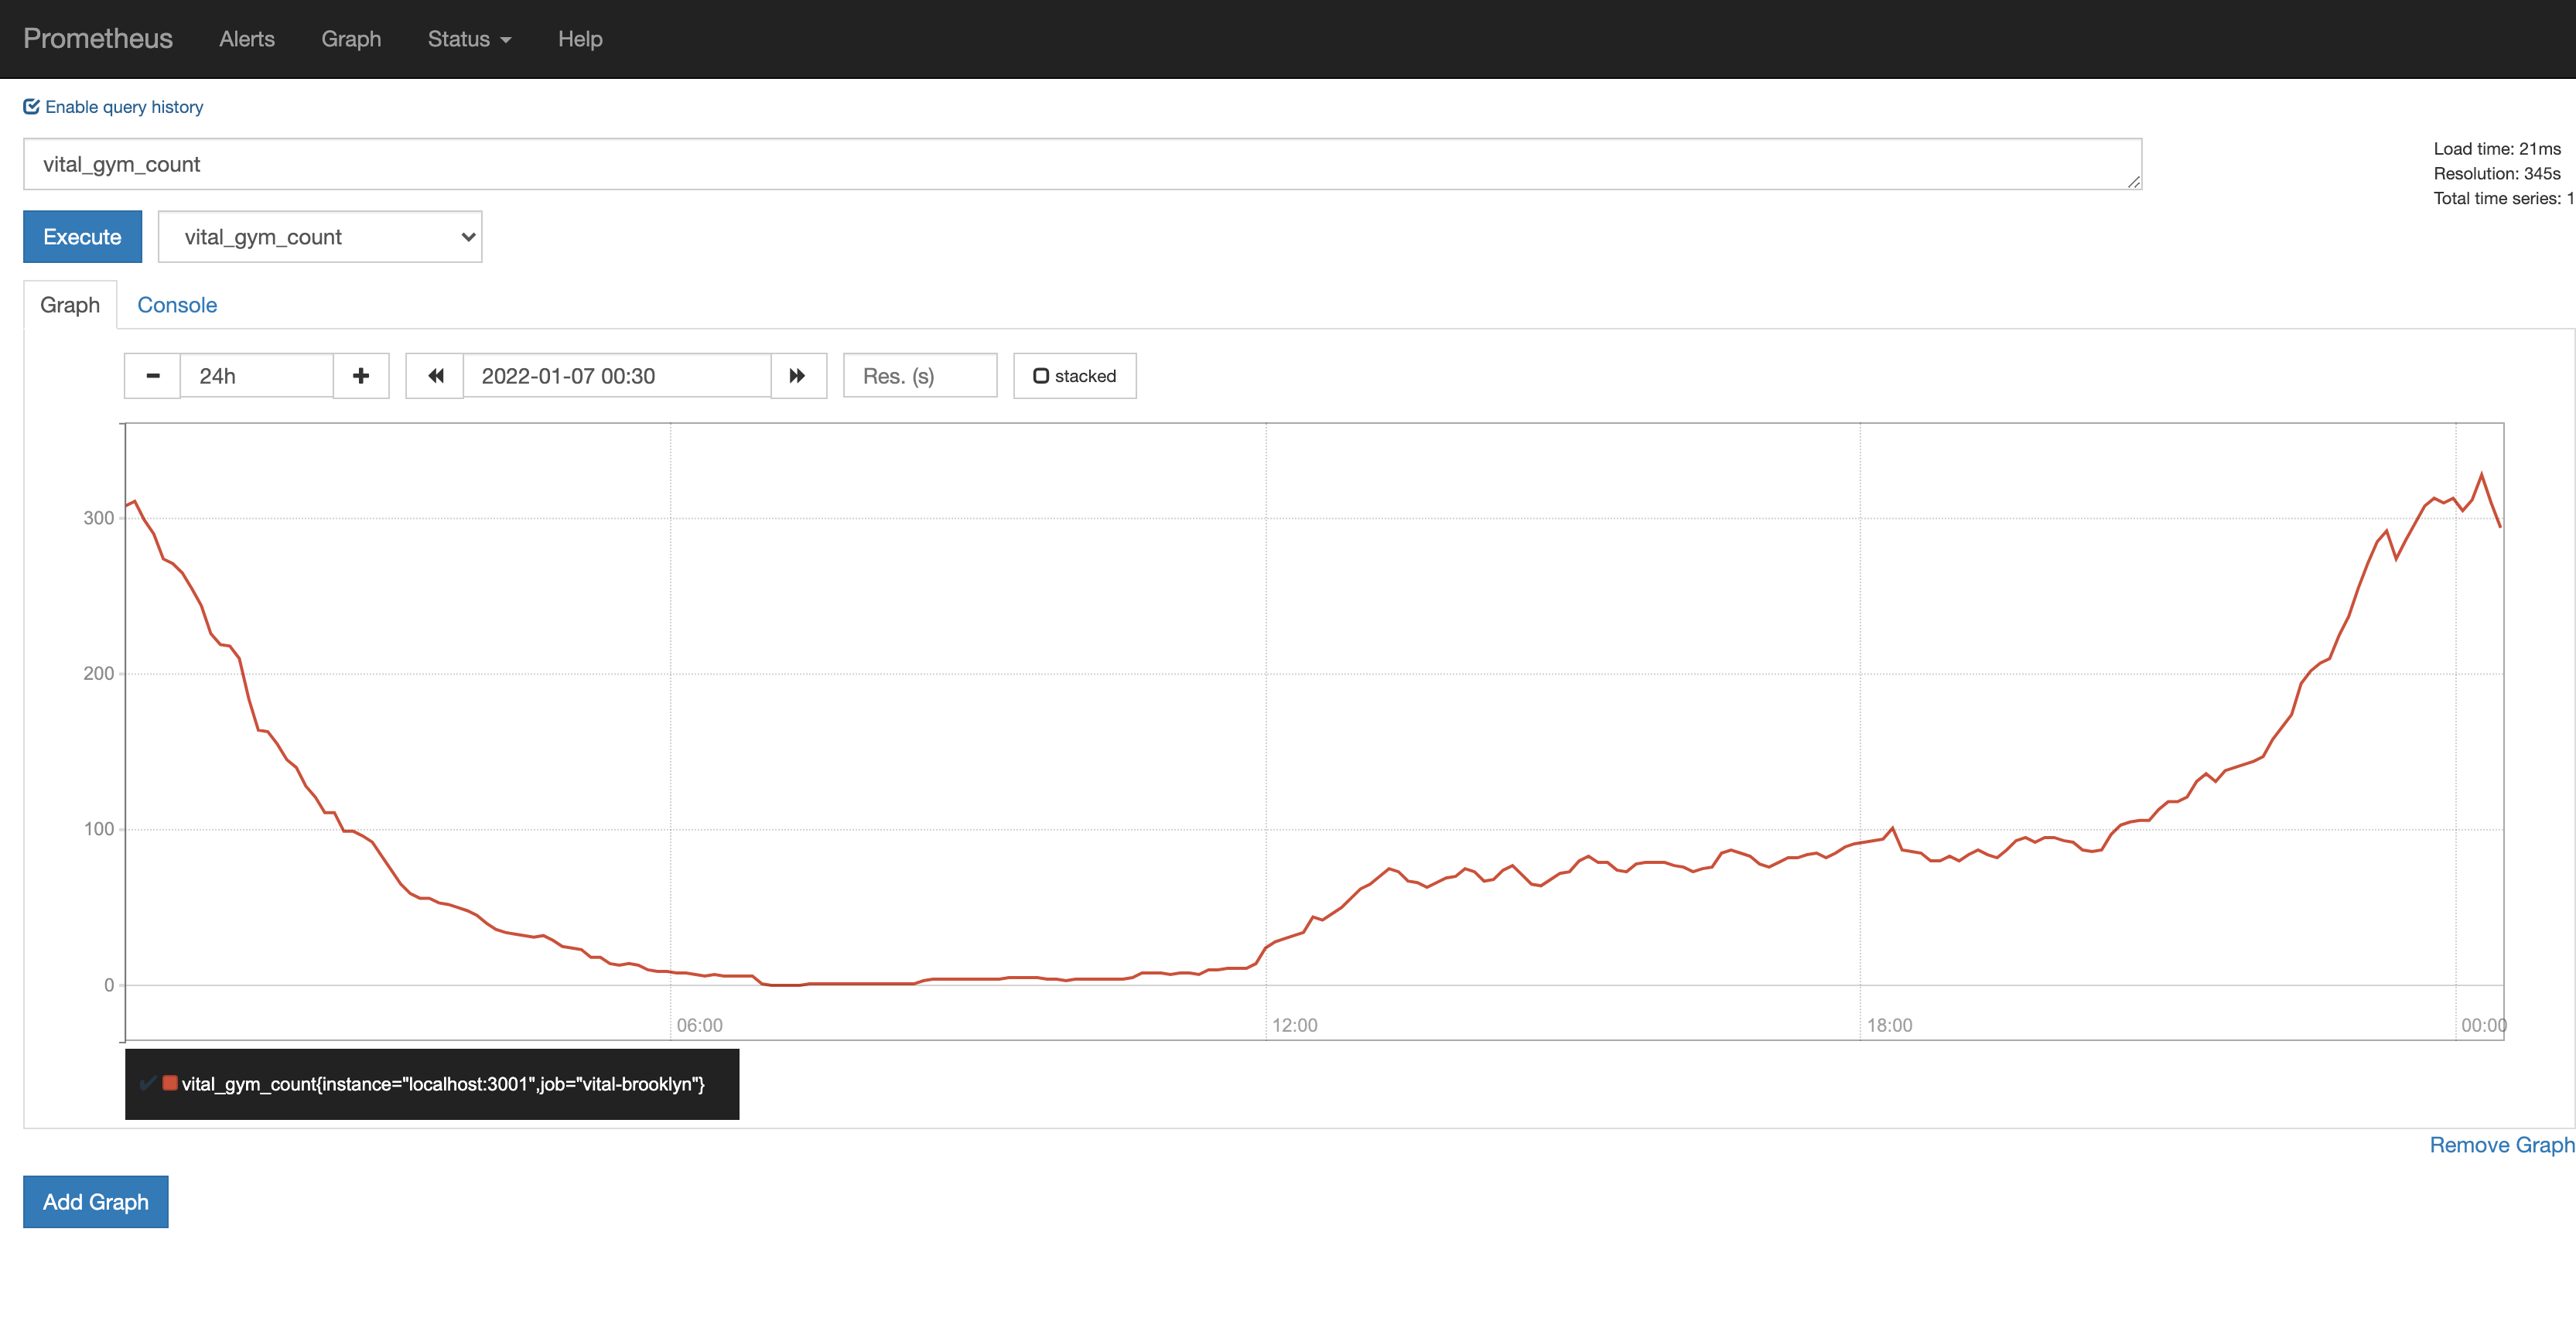
Prometheus is an open-source monitoring tool and time-series database (it collects data). With minimal configuration, I can tell it to go to the public API URL every 60 seconds and save the time and the headcount. There is a small snag here... Prometheus expects data in a human-readable OpenMetrics format which is just a label and value like this:
vital_gym_count 183
In order to feed the data into Prometheus, I created a small node.js service that takes the plain number and adds the label in front of it. This trivial, but necessary, custom code runs on the same server as everything else. Instead of getting the data directly from the API, it goes: Prometheus -> formatting server -> public API. I leave it on for 24 hours to scrape the data.
This would complete the assignment of answering "When should I go to the gym?" but that is way too easy and under-engineered for my taste. And I needed to procrastinate a lot more before I headed to the gym.
Grafana is an open-source analytics and interactive data visualizer (it makes graphs and charts). Grafana has built-in support for Prometheus so all I needed to do was add a link to the server and specify that I want a chart of the vital_gym_count data. That's it. While Prometheus was adequate at displaying and querying raw data, the added benefit of Grafana is being able to perform more detailed analysis (Are certain times on certain days better than others?). And the interface is much nicer.
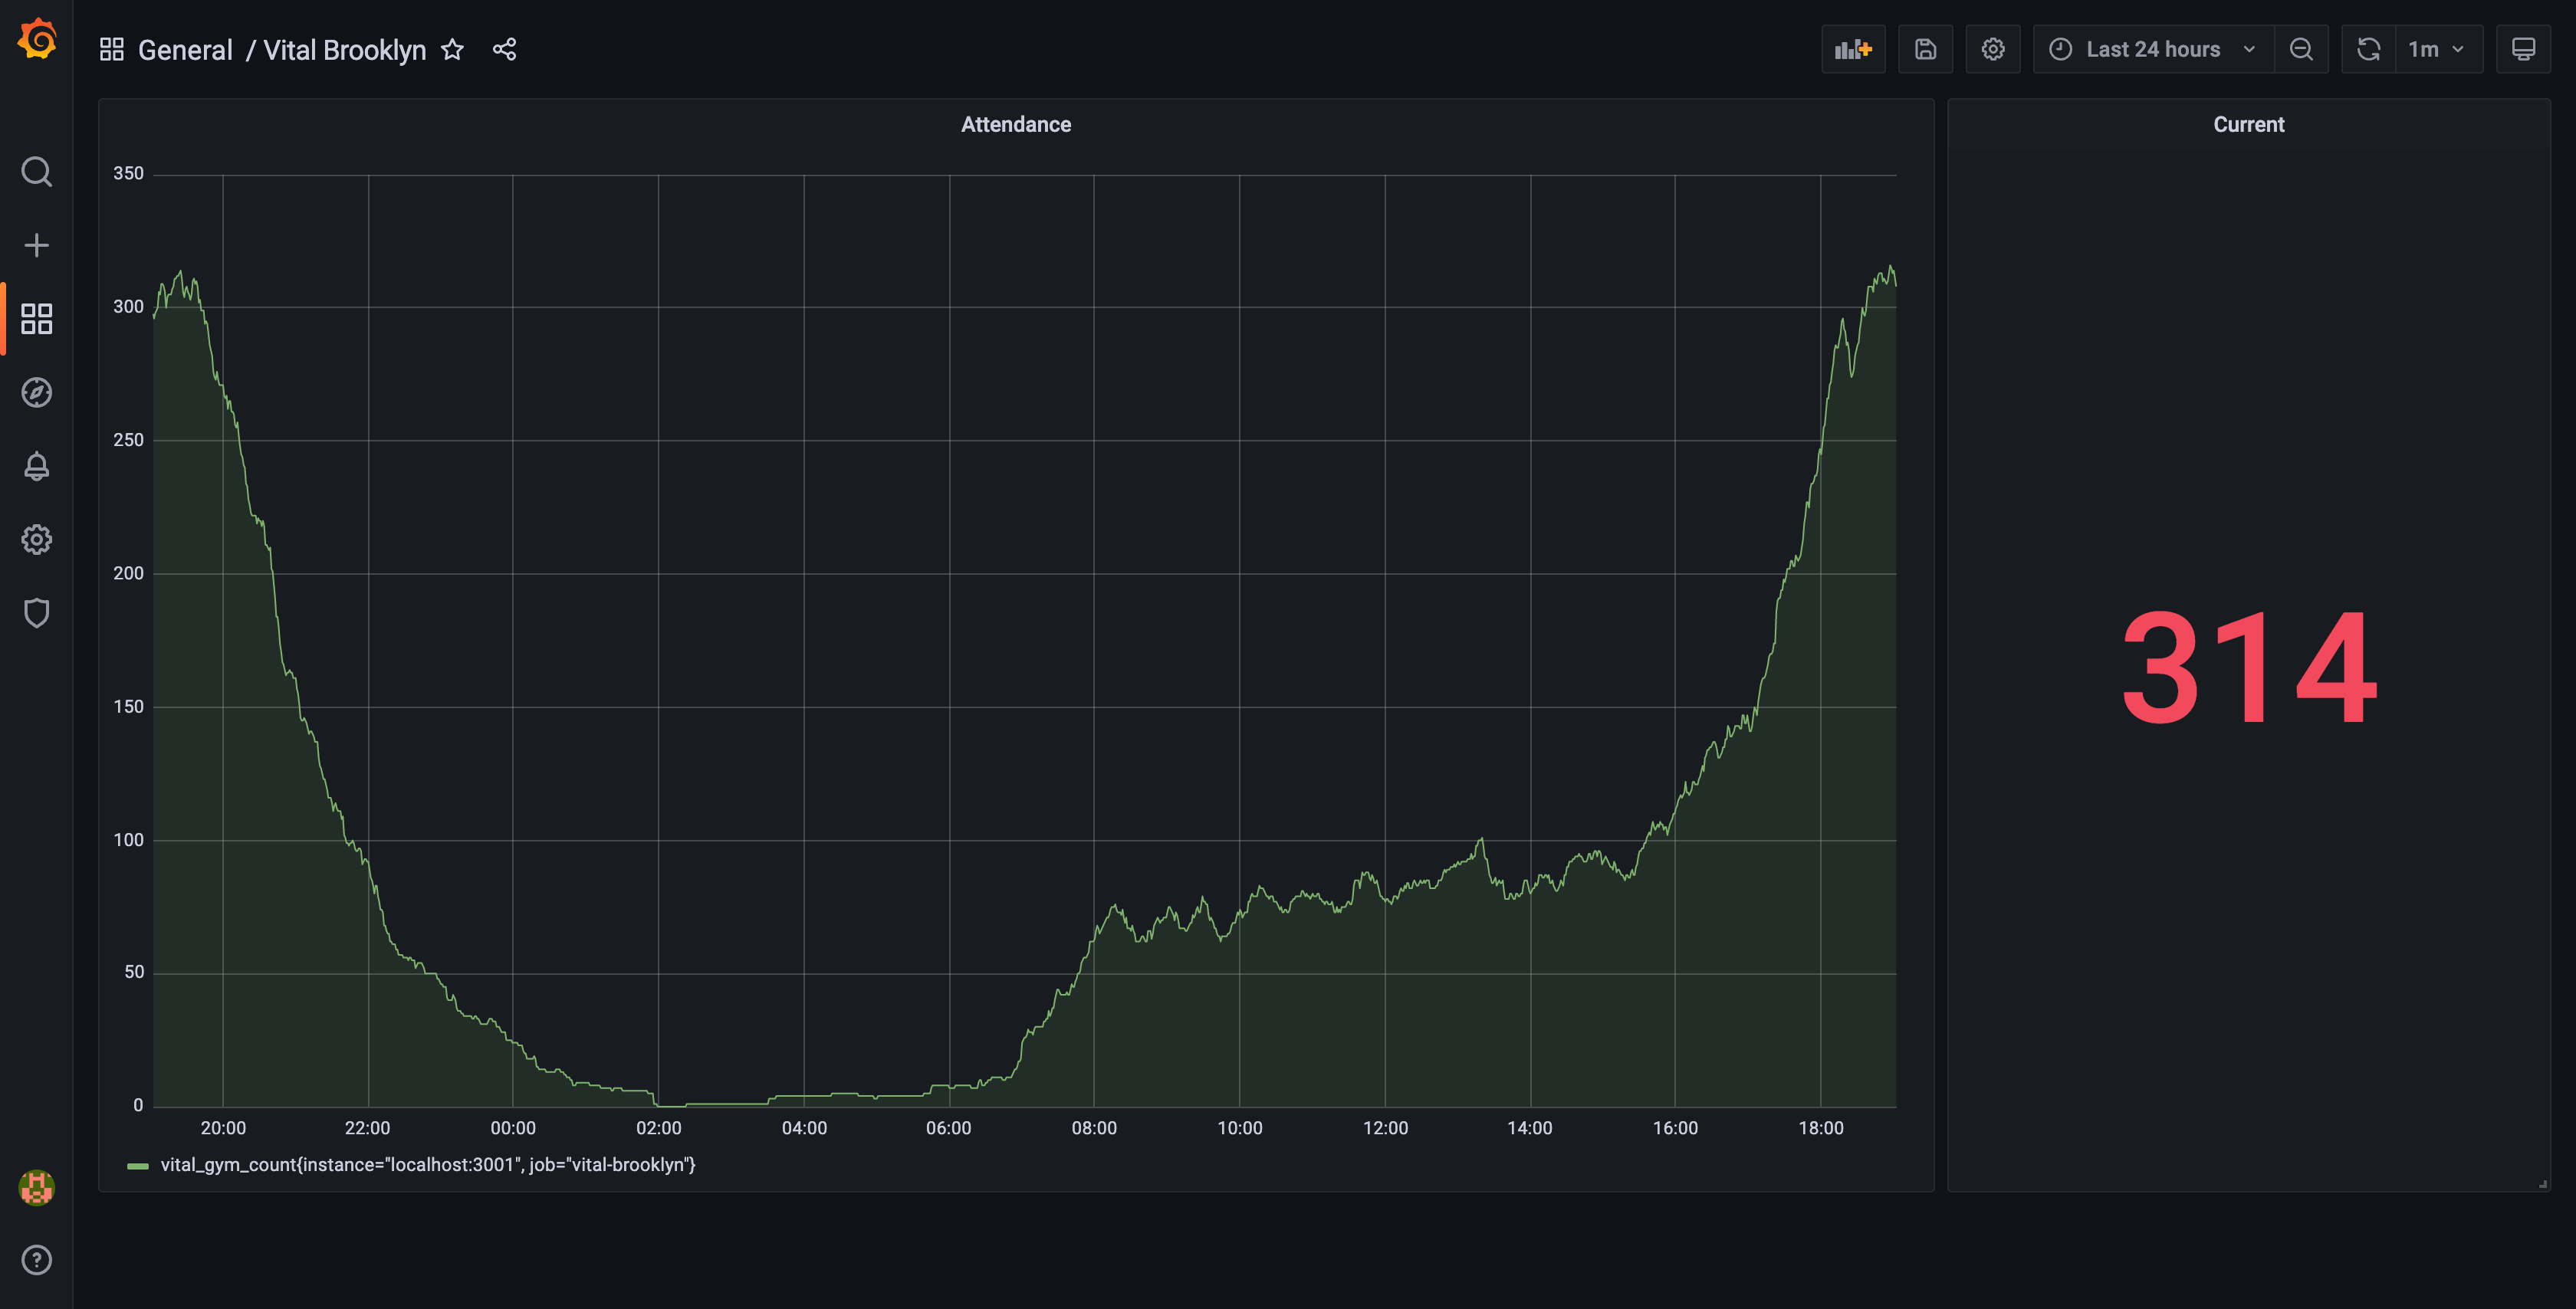
Overall this data-scraping/devops exercise took 30 minutes to execute, plus the 24 hours waiting for the data to come in. It may come as no surprise to some of you, but the worst time to go to this gym is the evening, after office business hours. Maybe I'll go in the morning.